Home
ВходРегистрация
Готовы торговать?
Регистрация

Graphical Analysis Simplified

Ever wondered how traders foresee market movements just by looking at a chart? The secret lies in mastering graphical analysis, a skill that can transform your trading decisions and elevate your success!

  1. Graphical analysis basics
  2. Trend recognition
  3. Support and resistance
  4. Trend reversals
  5. A chart-reading routine

Graphical analysis basics

Start by looking at the price chart without trying to predict the next move. Instead, focus on what the price has already been doing.

Look for:

  • The overall direction: Is price generally moving up, down, or sideways?

  • Recent highs and lows: Are they moving higher or lower?

  • Repeated price levels: Does price regularly stop or turn around around the same area?

  • Changes in behaviour: Is the price movement starting to look different from the earlier trend?

Using this simple checklist helps you read the chart systematically rather than reacting to every individual price movement.

Trend recognition

Trend recognition gives you the broader direction of the market. It’s a good place to start.

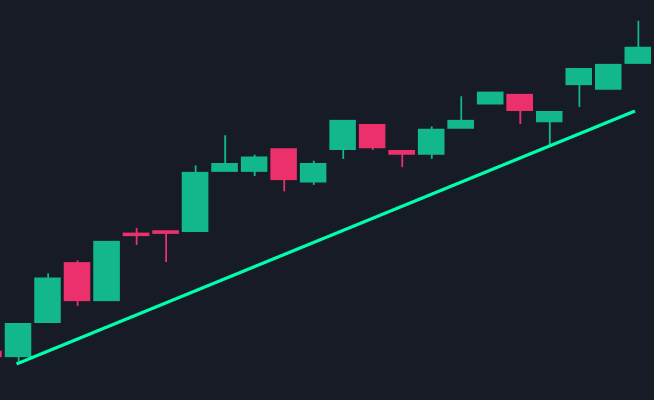
Look at the sequence of highs and lows. Higher highs and higher lows suggest an upward trend, while lower highs and lower lows suggest a downward trend. If neither pattern is clear and price keeps moving within a similar range, the market may be sideways.

That said, don't base your decision on just a single high or low. Zoom out and check whether the same pattern continues across several timeframes. You can then use the platform's charting and analysis tools to look at the trend in more detail.

Ed 201, Pic 1

Support and resistance

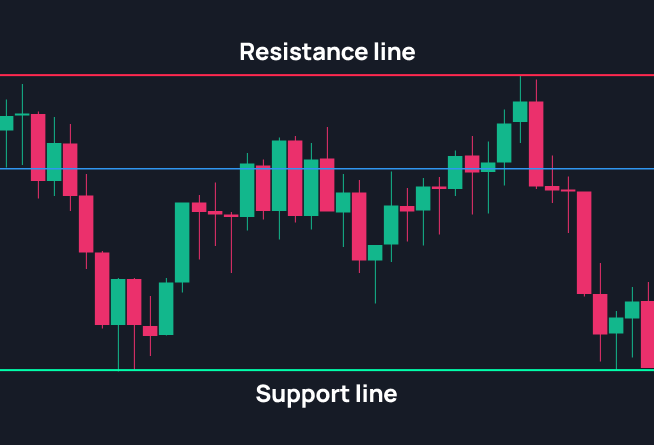
Next, look for areas where price has repeatedly struggled to move through or has changed direction. These are commonly referred to as support and resistance levels.

You can mark these areas on the chart by looking for previous points where price repeatedly bounced, stalled, or reversed. They can help you understand where price may face pressure if it reaches the same area again.

See our Support and Resistance guide for a more detailed explanation of how to identify and use these levels.

Ed 201, Pic 2

How to spot a trend reversal

Once you've identified the current trend, watch for signs that its structure is changing.

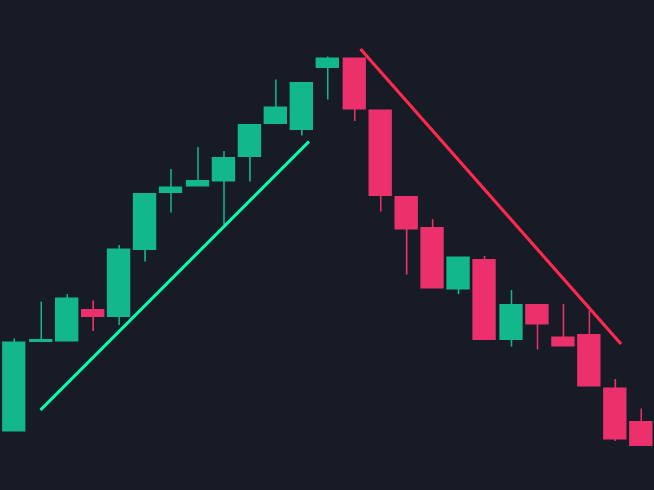
For an upward trend, watch for signs that the pattern of higher highs and higher lows is breaking down. For example, if price forms a lower high and then a lower low, it may indicate that the upward trend is weakening. The opposite applies to a downward trend: if price stops making lower highs and lower lows and starts forming higher highs and higher lows, it may signal that the downward trend is losing strength and a reversal could be developing.

A break of an important support or resistance level can also provide another clue. However, one price move isn't enough to confirm a reversal. Look for a change in the overall price structure and, where appropriate, use other charting tools for confirmation.

Ed 201, Pic 3

A simple chart-reading routine

When analysing a chart, you can work through these steps:

  • Start with the bigger picture. Identify whether the market is moving up, down, or sideways.

  • Check the price structure. Look at the most recent highs and lows.

  • Mark important levels. Note areas where price has previously reversed or stalled.

  • Watch for changes. Check whether the current pattern is continuing or beginning to break down.

  • Use your analysis tools. Add indicators or change the chart timeframe if you need more context.

  • Wait for confirmation. Avoid treating a single price movement as proof of a new trend or reversal.

Graphical analysis is ultimately about putting these observations together rather than relying on one pattern or level. With practice, it’ll be easier for you to actually read and understand the chart.

Готовы торговать?
Регистрация
ExpertOption

Компания не предоставляет услуги гражданам и/или резидентам Австралии, Австрии, Беларуси, Бельгии, Болгарии, Канады, Хорватии, Республики Кипр, Чехии, Дании, Эстонии, Финляндии, Франции, Германии, Греции, Венгрии, Исландии, Ирана, Ирландии, Израиля, Италии, Латвии, Лихтенштейна, Литвы, Люксембурга, Мальты, Мьянмы, Нидерландов, Новой Зеландии, Северной Кореи, Норвегии, Польши, Португалии, Пуэрто-Рико, Румынии, России, Сингапура, Словакии, Словении, Южного Судана, Испании, Судана, Швеции, Швейцарии, Великобритании, Украины, США, Йемена.

Трейдеры
Партнёрская программа
Partners ExpertOption

Способы оплаты

Payment and Withdrawal methods ExpertOption
Торговля и инвестирование связаны со значительным уровнем риска и подходят и/или целесообразны не для всех клиентов. Перед покупкой или продажей убедитесь, что вы тщательно продумали свои инвестиционные цели, уровень опыта и склонность к риску. Покупка или продажа сопряжена с финансовыми рисками и может привести к частичной или полной потере ваших средств, поэтому не следует инвестировать средства, которые вы не можете позволить себе потерять. Вы должны знать и полностью понимать все риски, связанные с торговлей и инвестированием. При возникновении каких-либо сомнений обратитесь за советом к независимому финансовому консультанту. Вам предоставляются ограниченные неисключительные права на использование интеллектуальной собственности, содержащейся на данном сайте, для личного, некоммерческого, не подлежащего передаче использования только в связи с услугами, предлагаемыми на сайте.
Поскольку компания EOLabs LLC не находится под надзором JFSA, она не участвует в каких-либо действиях, рассматриваемых как предложение финансовых продуктов и привлечение к оказанию финансовых услуг в Японии. Данный сайт не предназначен для резидентов Японии.
© 2014–2026 ExpertOption
ExpertOption. Все права защищены.